Acocks Green (ward)

 Clash Royale CLAN TAG#URR8PPP
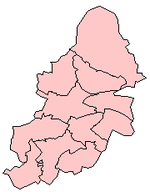
Acocks Green ward is an electoral ward in south-east Birmingham, England, and includes the districts of Acocks Green, Fox Hollies and Tyseley.
Contents
1 Ward history
2 Parliamentary Representation
3 Politics
4 Election results
4.1 2000s
4.2 1990s
4.3 1980s
4.4 1970s
4.5 1960s
4.6 1950s
4.7 1940s
Ward history
The parish of Yardley was included within Birmingham County Borough from 1911. The Birmingham ward was created in 1911 from part of the parish (which also created Sparkhill and Yardley wards). The electorate steadily climbed from 4,972 in 1911 to 17,333 in 1939.
The boundary changes to wards of 1934, saw Acocks Green ward lose its western area to Sparkhill ward and its southern portion to a new created Hall Green ward.
After the war the electorate again jumped to 24,556 in 1945 and climbed again until in 1949 it stood at 26,242. In the boundary changed of 1949/1950 the area south of Warwick Road was lost to Fox Hollies ward, and additional areas in Hay Mills and South Yardley (the northern boundary was the Coventry Road) were added. This moved the area covered substantially northwards. In the 1950 election the electorate had reduced to 16,412.
By the 1961 election the electorate had reduced to 14,390 and so the boundary changes of 1961/1962 once again saw the ward expanding. It took a small triangle of territory from Fox Hollies, and expanded northwards from the Coventry Road to Hob Moor Road. The electorate at the 1962 election was up to 20,570.
A further expansion of the boundaries was required at the changes in 1981/1982, and resulted in the loss of the area around Greet in the west of the ward, but the addition of areas north of Hob Mooor Road and south of Blakesley Road. The electorate increased from 19,133 in 1981 to 21,125 in 1982.
The boundary changes in 2003/2004 resulted in major changes, which saw the abolition of Fox Hollies ward and the creation of a South Yardley ward. Acocks Green ward therefore moved south to take substantial electors from Fox Hollies ward south of the Warwick Road, and restored the Grand Union canal as the northern boundary.
Parliamentary Representation
The parish of Yardley was part of the Worcestershire Eastern Division from 1832 until 1918.
At the boundary changes for the 1918 election the parishes and its City Borough wards were incorporated within Birmingham constituencies. Acocks Green ward became part of Birmingham Moseley constituency in 1918, and the electorate steadily grew from 41,546 in 1918 until it reached 101,169 at the 1935 election.
In 1945 a small number of the very biggest constituencies were divided and Acocks Green joined Hall Green ward in the newly created Birmingham Acocks Green seat.
Birmingham Acocks Green constituency was short lived and in the wholesale boundary changes that preceded the 1950 election, the ward was joined by Fox Hollies and Yardley wards in a Birmingham Yardley seat.
Once again this seat only had a short life, although it remained as Birmingham Yardley the wards which made up the seat were changed for the 1955 election to Acocks Green, Sheldon and Yardley. This time the seat was more settled and was left alone at the changes for the 1974, 1983 and 1997 boundary changes.
In 2010 the seat was enlarged, following the loss of a Birmingham constituency, and included Stechford & Yardley North, together with the South Yardley and Sheldon wards.
Politics
From its creation Acocks Green ward was generally a Conservative (or Liberal Unionist) seat, but occasional gains by Independents disrupted the pattern during the 1920s.
In 1945 Labour won the seat (plus a by-election) to give it representation for the first time. However, in 1946 the Tories regained the seat, and held on to it until 1952, when Labour won again. The seat was now more marginal and Labour won in 1954, 1956, 1958, 1963 and 1971.
The all out elections of 1973 (for the new Birmingham Metropolitan Borough), produced, as may have been expected, a split result, with two Tories and one Labour councillor. The Tories won all the elections for the ward in the 1970s, but then lost to Labour in 1980.
The boundary changes prior to the 1982 election once again produced a split result, again two Tories and one Labour councillor. The redrawn seat and the general demographics of the city meant that the new ward was a better bet for Labour and they duly won all the elections, until the Conservatives' good year of 1987, but that was a one off and Labour once again won in 1988.
However everything was all about to change, and in 1990 the Liberal Democrats seized the seat. John Hemming, who was later to become the MP for the Yardley constituency, won for the first time. The Liberal Democrats had won the ward at every election until 2011, when it swung strongly back to Labour. Labour gained a second seat in 2012, but the Liberal Democrats held their remaining seat in the 2014 elections.
Election results
2000s
| Party | Candidate | Votes | % | ± | |
|---|---|---|---|---|---|
Liberal Democrat | Iain Bowen | 4,374 | 41.9% | ||
Labour | Stewart Stacey | 3,400 | 32.5% | ||
Conservative | Joe Edginton | 1,416 | 13.6% | ||
BNP | Carl Brisker | 686 | 6.6% | ||
Green | Amanda Baker | 280 | 2.7% | ||
UKIP | John Butler | 233 | 2.2% | ||
SDP | Alan Ware | 21 | 0.2% | ||
| Majority | 974 | 9.4% | |||
Liberal Democrat hold | Swing | ||||
| Party | Candidate | Votes | % | ± | |
|---|---|---|---|---|---|
Liberal Democrat | Roger Harmer | 2,743 | 51.5% | ||
Labour | John O'Shea | 1,125 | 21.1% | ||
BNP | Tanya Whitehead | 617 | 11.6% | ||
Conservative | Emma Mahay | 598 | 11.2% | ||
| Majority | 1,618 | 30.4% | |||
Liberal Democrat hold | Swing | ||||
| Party | Candidate | Votes | % | ± | |
|---|---|---|---|---|---|
Liberal Democrat | Penny Wagg | 3,072 | 52.0% | ||
Labour | John O'Shea | 1,452 | 24.6% | ||
BNP | Ben Lumby | 536 | 9.1% | ||
Conservative | Hannah Axford | 508 | 8.6% | ||
Green | Amanda Baker | 258 | 4.4% | ||
UKIP | Peter Hillman | 77 | 1.3% | ||
| Majority | % | ||||
Labour gain from Liberal | Swing | ||||
Liberal Democrat hold | Swing | ||||
| Party | Candidate | Votes | % | ± | |
|---|---|---|---|---|---|
Liberal Democrat | Iain Bowen | 2,607 | 43.0% | ||
Labour | John O'Shea | 1,632 | 26.9% | ||
BNP | Patrick Collins | 927 | 15.3% | ||
Conservative | Kenneth Axford | 630 | 10.4% | ||
Green | Mina Coalter | 261 | 4.3% | ||
| Majority | % | ||||
Labour gain from Liberal | Swing | ||||
Liberal Democrat hold | Swing | ||||
| Party | Candidate | Votes | % | ± | |
|---|---|---|---|---|---|
Liberal Democrat | Nicola Henry | 3,519 | % | ||
Liberal Democrat | Penelope Wagg | 3,502 | % | ||
Liberal Democrat | Francis Coyne | 3,463 | % | ||
Labour | John O'Shea | 1,289 | % | ||
Labour | Allen Samuel | 1,234 | % | ||
Labour | Suraiya Makhdoom | 946 | % | ||
BNP | Patrick Collins | 892 | % | ||
Conservative | Hilda Brien | 620 | % | ||
Conservative | Sarah Frankley | 624 | % | ||
Green | Richard Batsford | 581 | % | ||
Conservative | Ann Haston | 524 | % | ||
| Majority | % | ||||
Labour gain from Liberal | Swing | ||||
Liberal Democrat hold | Swing | ||||
| Party | Candidate | Votes | % | ± | |
|---|---|---|---|---|---|
Liberal Democrat | J Whorwood | 3,596 | 68.0% | ||
Labour | S Makhdoom | 1,110 | 21.0% | ||
Conservative | E Lear | 560 | 10.6% | ||
| Majority | 2,486 | 47.0% | |||
Liberal Democrat hold | Swing | ||||
| Party | Candidate | Votes | % | ± | |
|---|---|---|---|---|---|
Liberal Democrat | John Hemming | 3,675 | 64.1% | ||
Labour | P Holbrook | 1,501 | 26.2% | ||
Conservative | Alan Bluemnthal | 501 | 8.7% | ||
| Majority | 2,174 | 37.9% | |||
Liberal Democrat hold | Swing | ||||
| Party | Candidate | Votes | % | ± | |
|---|---|---|---|---|---|
Liberal Democrat | D Osborn | 2,820 | 55.5% | ||
Labour | B O'Brien | 1,392 | 27.4% | ||
Conservative | B Roberts | 849 | 16.7% | ||
| Majority | 1,428 | 28.1% | |||
Liberal Democrat hold | Swing | ||||
1990s
| Party | Candidate | Votes | % | ± | |
|---|---|---|---|---|---|
Liberal Democrat | J Whorwood | 2,694 | 51.4% | ||
Labour | B O'Brien | 1,814 | 34.6% | ||
Conservative | B Roberts | 699 | 13.3% | ||
| Majority | 720 | 16.8% | |||
Liberal Democrat hold | Swing | ||||
| Party | Candidate | Votes | % | ± | |
|---|---|---|---|---|---|
Liberal Democrat | John Hemming | 3,146 | 61.2% | ||
Labour | B O'Brien | 1,521 | 29.6% | ||
Conservative | J Hill | 471 | 9.2% | ||
| Majority | 1,625 | 31.6% | |||
Liberal Democrat hold | Swing | ||||
| Party | Candidate | Votes | % | ± | |
|---|---|---|---|---|---|
Liberal Democrat | David Osborne | 3,339 | 56.0% | ||
Labour | N Cunningham | 1,873 | 31.4% | ||
Conservative | P Osborn | 612 | 10.3% | ||
Independent | P Cartlidge | 124 | 2.1% | ||
| Majority | 1,466 | 24.6% | |||
Liberal Democrat hold | Swing | ||||
| Party | Candidate | Votes | % | ± | |
|---|---|---|---|---|---|
Liberal Democrat | N Biddlestone | 3,646 | 52.6% | ||
Labour | I Jamieson | 2,476 | 35.7% | ||
Conservative | D Hopwood | 752 | 10.8% | ||
| Majority | 1,170 | 16.9% | |||
Liberal Democrat hold | Swing | ||||
| Party | Candidate | Votes | % | ± | |
|---|---|---|---|---|---|
Liberal Democrat | John Hemming | 4,917 | 57.5% | ||
Labour | I Jamieson | 2,560 | 29.9% | ||
Conservative | D O'Hagan | 1,003 | 11.7% | ||
| Majority | 2,357 | 27.6% | |||
Liberal Democrat hold | Swing | ||||
| Party | Candidate | Votes | % | ± | |
|---|---|---|---|---|---|
Liberal Democrat | C Powell | 3,064 | 39.9% | ||
Conservative | D Clarke | 2,358 | 30.7% | ||
Labour | M Nangle | 1,993 | 25.9% | ||
Green | G Grianger | 101 | 1.3% | ||
Social Democratic | M Hegarty | 84 | 1.1% | ||
Independent Labour | M Ariss | 67 | 0.9% | ||
| Majority | 706 | 9.2% | |||
Liberal Democrat gain from Labour | Swing | ||||
| Party | Candidate | Votes | % | ± | |
|---|---|---|---|---|---|
Liberal Democrat | P Scholfield | 5,017 | 55.1% | ||
Labour | Stan Yapp | 2,243 | 24.7% | ||
Conservative | A Unitt | 1,674 | 18.4% | ||
Green | P Gozra | 149 | 1.6% | ||
| Majority | 2,774 | 30.4% | |||
Liberal Democrat gain from Labour | Swing | ||||
| Party | Candidate | Votes | % | ± | |
|---|---|---|---|---|---|
Liberal Democrat | John Hemming | 4,197 | 40.8% | ||
Labour | P Haymeraj | 3,890 | 37.8% | ||
Conservative | A Clarke | 1,894 | 18.4% | ||
Green | S Higgens | 305 | 3.0% | ||
| Majority | 307 | 3.0% | |||
Liberal Democrat gain from Labour | Swing | ||||
1980s
| Party | Candidate | Votes | % | ± | |
|---|---|---|---|---|---|
Labour | M Nangle | 4,223 | 52.2% | ||
Conservative | A Clarke | 3,121 | 38.6% | ||
Social Democratic | B Buggins | 549 | 6.8% | ||
Green | J Bentley | 197 | 2.4% | ||
| Majority | 1,202 | 13.6% | |||
Labour hold | Swing | ||||
| Party | Candidate | Votes | % | ± | |
|---|---|---|---|---|---|
Conservative | P McAuley | 3,644 | 38.9% | ||
Labour | B Acker | 3,352 | 35.8% | ||
SDP–Liberal Alliance | C Powell | 2,374 | 25.4% | ||
| Majority | 292 | 3.1% | |||
Conservative gain from Labour | Swing | ||||
| Party | Candidate | Votes | % | ± | |
|---|---|---|---|---|---|
Labour | P Haymeraj | 3,269 | 41.6% | ||
Conservative | D Best | 2,512 | 31.9% | ||
SDP–Liberal Alliance | C Powell | 2,092 | 26.6% | ||
| Majority | 757 | 10.3% | |||
Labour gain from Conservative | Swing | ||||
| Party | Candidate | Votes | % | ± | |
|---|---|---|---|---|---|
Labour | M Nangle | 4,271 | 48.3% | ||
Conservative | C Collett | 3,458 | 39.1% | ||
SDP–Liberal Alliance | R de Havilland | 1,102 | 12.5% | ||
| Majority | 813 | 9.2% | |||
Labour gain from Conservative | Swing | ||||
| Party | Candidate | Votes | % | ± | |
|---|---|---|---|---|---|
Labour | B Acker | 4,186 | 45.2% | ||
Conservative | G Postles | 3,996 | 43.1% | ||
SDP–Liberal Alliance | R de Havilland | 1,058 | 11.4% | ||
| Majority | 190 | 2.1% | |||
Labour hold | Swing | ||||
| Party | Candidate | Votes | % | ± | |
|---|---|---|---|---|---|
Conservative | D Best | 3,163 | 39.2% | ||
Conservative | C Collett | 3,040 | 37.7% | ||
Labour | B Acker | 2,977 | 36.9% | ||
Labour | G Bradnock | 2,643 | 32.8% | ||
Conservative | G Postles | 2,794 | 34.6% | ||
Labour | W Jarvis | 2,449 | 30.3% | ||
SDP–Liberal Alliance | C Gray | 1,763 | 21.8% | ||
SDP–Liberal Alliance | P Jones-Owen | 1,686 | 20.9% | ||
SDP–Liberal Alliance | D Lawson | 1,567 | 19.4% | ||
| Majority | 520, | % | |||
Labour gain from Liberal | Swing | ||||
Conservative hold | Swing | ||||
| Party | Candidate | Votes | % | ± | |
|---|---|---|---|---|---|
Labour | B Acker | 3,912 | 55.0% | ||
Conservative | L McCulloch | 3,104 | 43.6% | ||
National Front | B McEwan | 98 | 1.4% | ||
| Majority | 808 | 11.4% | |||
Labour gain from Conservative | Swing | ||||
1970s
| Party | Candidate | Votes | % | ± | |
|---|---|---|---|---|---|
Conservative | D Rose | 6,917 | 50.7% | ||
Labour | B Acker | 6,724 | 49.3% | ||
| Majority | 193 | 1.4% | |||
Conservative hold | Swing | ||||
| Party | Candidate | Votes | % | ± | |
|---|---|---|---|---|---|
Conservative | C Collett | 3,795 | 52.6% | ||
Labour | B Acker | 3,078 | 42.7% | ||
National Front | C Finch | 297 | 4.1% | ||
Independent | P Tuey | 39 | 0.5% | ||
| Majority | 717 | 9.9% | |||
Conservative hold | Swing | ||||
| Party | Candidate | Votes | % | ± | |
|---|---|---|---|---|---|
Conservative | L McCulloch | 4,039 | 55.6% | ||
Labour | B Acker | 2,939 | 40.4% | ||
Liberal | D Precelton | 272 | 3.7% | ||
| Majority | 1,100 | 15.2% | |||
Conservative gain from Labour | Swing | ||||
| Party | Candidate | Votes | % | ± | |
|---|---|---|---|---|---|
Conservative | D Rose | 3,537 | 57.2% | ||
Labour | Levy | 2,105 | 34.0% | ||
Liberal | D Precelton | 541 | 8.7% | ||
| Majority | 1,432 | 23.2% | |||
Conservative hold | Swing | ||||
| Party | Candidate | Votes | % | ± | |
|---|---|---|---|---|---|
Conservative | C Collett | 3,281 | 55.4% | ||
Labour | B Acker | 3,105 | 52.5% | ||
Conservative | R Jauncey | 2,946 | 49.7% | ||
Labour | D Goodall | 2,920 | 49.3% | ||
Conservative | D Rose | 2,882 | 48.7% | ||
Labour | G Samuels | 2,632 | 44.4% | ||
| Majority | 361, 185 & 26 | 6.1%, 3.1% & 0.4% | |||
Conservative gain from Labour | Swing | ||||
Conservative hold | Swing | ||||
Labour hold | Swing | ||||
| Party | Candidate | Votes | % | ± | |
|---|---|---|---|---|---|
Labour | D Goodall | 3,635 | 51.8% | ||
Conservative | J Bailey | 3,383 | 48.2% | ||
| Majority | 252 | 3.6% | |||
Labour gain from Conservative | Swing | ||||
| Party | Candidate | Votes | % | ± | |
|---|---|---|---|---|---|
Labour | B Acker | 4,164 | 57.3% | ||
Conservative | M Taylor | 3,104 | 42.7% | ||
| Majority | 1,060 | 14.6% | |||
Labour gain from Conservative | Swing | ||||
| Party | Candidate | Votes | % | ± | |
|---|---|---|---|---|---|
Conservative | J Silk | 3,528 | 60.8% | ||
Labour | S Gray | 2,274 | 39.2% | ||
| Majority | 1,254 | 21.6% | |||
Conservative hold | Swing | ||||
1960s
| Party | Candidate | Votes | % | ± | |
|---|---|---|---|---|---|
Conservative | J Bailey | 4,046 | 74.1% | ||
Labour | W Raybone | 1,414 | 25.9% | ||
| Majority | 2,632 | 48.2% | |||
Conservative hold | Swing | ||||
| Party | Candidate | Votes | % | ± | |
|---|---|---|---|---|---|
Conservative | C Collett | 4,802 | 77.5% | ||
Labour | R Thrupp | 1,394 | 22.5% | ||
| Majority | 3,408 | 55.0% | |||
Conservative hold | Swing | ||||
| Party | Candidate | Votes | % | ± | |
|---|---|---|---|---|---|
Conservative | J Silk | 4,468 | 69.5% | ||
Labour | J Morris | 1,962 | 30.5% | ||
| Majority | 2,506 | 39.0% | |||
Conservative hold | Swing | ||||
| Party | Candidate | Votes | % | ± | |
|---|---|---|---|---|---|
Conservative | J Bailey | 4,274 | 53.8% | ||
Labour | G Evans | 3,670 | 46.4% | ||
| Majority | 604 | 7.4% | |||
Conservative gain from Labour | Swing | ||||
| Party | Candidate | Votes | % | ± | |
|---|---|---|---|---|---|
Conservative | C Collett | 5,379 | 65.0% | ||
Labour | P Carter | 2,892 | 35.0% | ||
| Majority | 2,487 | 30.0% | |||
Conservative hold | Swing | ||||
| Party | Candidate | Votes | % | ± | |
|---|---|---|---|---|---|
Conservative | J Silk | 4,205 | 52.3% | ||
Labour | G Hartland | 3,832 | 47.7% | ||
| Majority | 373 | 4.6% | |||
Conservative hold | Swing | ||||
| Party | Candidate | Votes | % | ± | |
|---|---|---|---|---|---|
Labour | E Raven | 3,958 | 50.3% | ||
Conservative | L Howes | 3,908 | 49.7% | ||
| Majority | 50 | 0.6% | |||
Labour gain from Conservative | Swing | ||||
| Party | Candidate | Votes | % | ± | |
|---|---|---|---|---|---|
Conservative | C Collett | 4,276 | 54.5% | ||
Labour | W Pringle | 3,567 | 45.5% | ||
| Majority | 709 | 9.0% | |||
Conservative hold | Swing | ||||
| Party | Candidate | Votes | % | ± | |
|---|---|---|---|---|---|
Conservative | J Silk | 3,554 | 54.7% | ||
Labour | W Pringle | 2,944 | 45.3% | ||
| Majority | 610 | 9.4% | |||
Conservative gain from Labour | Swing | ||||
| Party | Candidate | Votes | % | ± | |
|---|---|---|---|---|---|
Conservative | H Seccombe | 3,523 | 64.0% | ||
Labour | W Pringle | 1,983 | 36.0% | ||
| Majority | 1,540 | 28.0% | |||
Conservative hold | Swing | ||||
1950s
| Party | Candidate | Votes | % | ± | |
|---|---|---|---|---|---|
Conservative | C Collett | 4,051 | 56.9% | ||
Labour | J Walsh | 3,068 | 43.1% | ||
| Majority | 983 | 13.8% | |||
Conservative gain from Labour | Swing | ||||
| Party | Candidate | Votes | % | ± | |
|---|---|---|---|---|---|
Labour | A Taylor | 3,214 | 50.0% | ||
Conservative | C Collett | 3,210 | 50.0% | ||
| Majority | 4 | 0.0% | |||
Labour gain from Conservative | Swing | ||||
| Party | Candidate | Votes | % | ± | |
|---|---|---|---|---|---|
Conservative | J Vernon | 3,337 | 51.0% | ||
Labour | S Wall | 3,202 | 49.0% | ||
| Majority | 135 | 2.0% | |||
Conservative gain from Labour | Swing | ||||
| Party | Candidate | Votes | % | ± | |
|---|---|---|---|---|---|
Labour | J Walsh | 3,209 | 51.5% | ||
Conservative | J Vernon | 3,024 | 48.5% | ||
| Majority | 185 | 3.0% | |||
Labour gain from Conservative | Swing | ||||
| Party | Candidate | Votes | % | ± | |
|---|---|---|---|---|---|
Conservative | C Collett | 4,120 | 54.6% | ||
Labour | G Evans | 3,429 | 45.4% | ||
| Majority | 691 | 9.2% | |||
Conservative gain from Labour | Swing | ||||
| Party | Candidate | Votes | % | ± | |
|---|---|---|---|---|---|
Labour | S Wall | 3,805 | 51.3% | ||
Conservative | N Bradbeer | 3,614 | 48.7% | ||
| Majority | 191 | 2.6% | |||
Labour gain from Conservative | Swing | ||||
| Party | Candidate | Votes | % | ± | |
|---|---|---|---|---|---|
Conservative | S Postle | 3,677 | 51.4% | ||
Labour | S Wall | 3,472 | 48.6% | ||
| Majority | 205 | 2.8% | |||
Conservative hold | Swing | ||||
| Party | Candidate | Votes | % | ± | |
|---|---|---|---|---|---|
Labour | G Evans | 5,057 | 57.0% | ||
Conservative | B Davis | 3,822 | 43.0% | ||
| Majority | 1,235 | 14.0% | |||
Labour gain from Conservative | Swing | ||||
| Party | Candidate | Votes | % | ± | |
|---|---|---|---|---|---|
Conservative | N Bradbeer | 4,438 | 57.7% | ||
Labour | G Turner | 3,253 | 42.3% | ||
| Majority | 1,185 | 15.4% | |||
Conservative hold | Swing | ||||
| Party | Candidate | Votes | % | ± | |
|---|---|---|---|---|---|
Conservative | S Postle | 4,376 | 53.0% | ||
Labour | J Cole | 3,885 | 47.0% | ||
| Majority | 491 | 6.0% | |||
Conservative hold | Swing | ||||
1940s
| Party | Candidate | Votes | % | ± | |
|---|---|---|---|---|---|
Conservative | B Davis | 7,512 | 54.2% | ||
Conservative | S Postle | 7,387 | 53.3% | ||
Labour | C Beer | 6,034 | 43.6% | ||
Labour | E Bartleet | 5,968 | 43.1% | ||
| Majority | 1,478 & 1,353 | 10.6% & 9.7% | |||
Conservative gain from Labour | Swing | ||||
Conservative hold | Swing | ||||
| Party | Candidate | Votes | % | ± | |
|---|---|---|---|---|---|
Conservative | N Bradbeer | 7,949 | 57.5% | ||
Labour | V Jackson | 5,871 | 42.5% | ||
| Majority | 2,078 | 15.0% | |||
Conservative gain from Labour | Swing | ||||
| Party | Candidate | Votes | % | ± | |
|---|---|---|---|---|---|
Conservative | O Gloster | 5,031 | 51.8% | ||
Labour | H Wynshenck | 4,366 | 45.0% | ||
Communist | S Blackwell | 316 | 3.3% | ||
| Majority | 665 | 6.8% | |||
Conservative hold | Swing | ||||
| Party | Candidate | Votes | % | ± | |
|---|---|---|---|---|---|
Labour | W Kirby | 5,323 | 49.7% | ||
Labour | V Jackson | 5,314 | 49.6% | ||
Conservative | R Scorer | 3,807 | 35.5% | ||
Conservative | A Harrison | 3,541 | 33.1% | ||
Liberal | T Veitch | 1,485 | 13.9% | ||
| Majority | 1,516 & 1,507 | 14.2% & 14.1% | |||
Labour gain from Conservative | Swing | n/a | |||
Labour gain from Conservative | Swing | n/a | |||
Birmingham council constituencies and wards | ||
| Edgbaston |
|  |
| Erdington |
| |
| Hall Green |
| |
| Hodge Hill |
| |
| Ladywood |
| |
| Northfield |
| |
| Perry Barr |
| |
| Selly Oak |
| |
| Sutton Coldfield |
| |
| Yardley |
| |